About us

Discover New Insights
Our data analytics services provide businesses with the tools they need to harness their data effectively. We specialize in predictive analytics, data visualization, and business intelligence to help you make data-driven decisions.
Start with the data – understand what it reveals and act on it.
Our process in four easy steps
1
Understand Your Goals
We start by meeting with you to identify your business objectives, data challenges, and what success looks like. This ensures our analysis aligns perfectly with your needs. .
2
Collect & Prepare Your Data
We gather data from all relevant sources and clean it — removing duplicates, fixing errors, and standardizing formats to make sure your data is reliable and analysis-ready.
3
Analyze & Visualize
We perform in-depth analysis using tools like Excel, Power BI, or Python to uncover patterns, trends, and insights. Then we design easy-to-understand dashboards and reports to present our findings clearly.
4
Deliver Actionable Insights
We walk you through the results, highlighting key takeaways and practical recommendations you can act on immediately to improve decision-making and drive business growth.
OUR TOOL OF WORK
PowerBi
Microsoft’s BI tool for building interactive dashboards and visual reports — popular for business users.

Tableau
Industry-leading data visualization tool for creating advanced, interactive charts and dashboards.

Google sheets
Cloud-based spreadsheet alternative to Excel, ideal for collaborative analytics and lightweight reporting.

Excell
Classic tool for data cleaning, analysis, pivot tables, and quick dashboards — still the backbone of analytics in many organizations.

SQL (Structured Query Language)
Essential for querying, manipulating, and managing data stored in relational databases like MySQL, PostgreSQL, SQL Server, or Oracle.

Python
Widely used programming language with libraries like Pandas, NumPy, and Matplotlib for advanced analytics, automation, and data visualization.
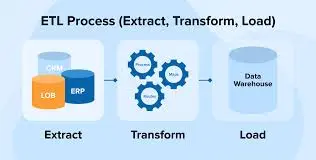
ETL Tools
Like Talend, Apache NiFi, or Alteryx — used to extract, transform, and load data from different sources into analytics-ready formats.
BigQuery
Google’s cloud data warehouse solution for analyzing large datasets quickly and cost-effectively. .

R
Powerful language focused on statistical analysis, modeling, and data science; great for in-depth statistical work.
Meet our analytics experts
Dedicated professionals driving our data analytics success

Peter Mutua
Lead Data Analyst
Founder and Lead Data Analyst, Peter is the visionary behind the analytics platform. He actively engages in data analysis, Bi tools development, marketing, and enhancing user experience.

Aline Turner
Data scientisst
Aline is a passionate data strategist who empowers over 100 analysts and nurtures a community of thousands of data professionals.